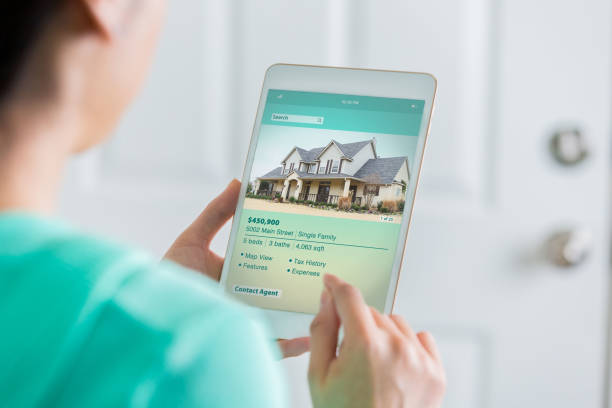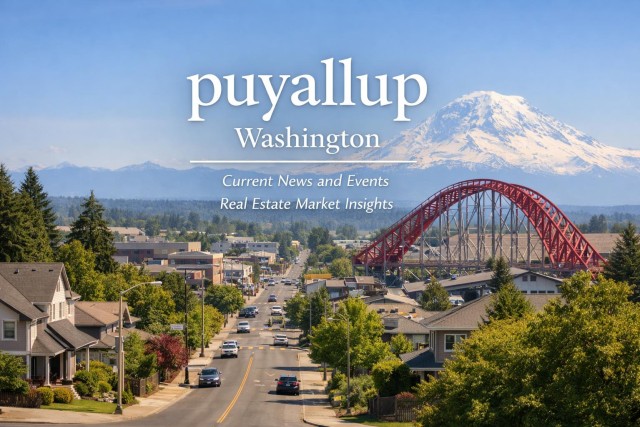

What defines smart decision making in Puyallup, WA today? For January 2026, it’s about knowing exactly which housing metrics matter and why. This month’s market reveals patterns every buyer, seller, and investor can turn into a competitive advantage.
Puyallup’s median estimated property value has reached $573,940, reflecting a year-over-year gain of 2.4 percent and signaling steady progress. Although the city experienced a marginal 0.2 percent decrease from last month, the median sold price for December 2025 climbed to $540,000, up 1.6 percent, suggesting ongoing buyer demand. For those pursuing affordable homes in Puyallup, WA this January 2026, these signs are encouraging, supporting long term confidence along with near term opportunity.
Analyzing Market Segments in Puyallup, WA
Both ownership and rental rates show balance: 51 percent of homes are owned while 49 percent are rented. This blend keeps inventory in motion and broadens your strategy, whether you are searching for your next home or preparing to list. Closed sales this month covered price points from $287,500 all the way up to $749,989, with the average price per square foot at $309. Why does this matter for buyers? Well, a diverse price and size range lets more potential homeowners participate—while sellers benefit from higher price per square foot and strong demand.
Housing market dynamics in Puyallup, WA also extend to distressed inventory, where ten such properties were sold in the last three months with median prices around $530,230. These sales appeal to both investors and buyers seeking less common opportunities, reinforcing the city’s broad based appeal in January 2026.
Reviewing Closing Data and Trends
Buyers will notice that homes in Puyallup range from 1,136 to 2,845 square feet in recent closed sales, and the median age for properties is 34 years. Sellers can use market shifts like a 2.4 percent annual rise in property value to justify competitive asking prices and attract qualified traffic. Why focus on these details? Every stat is a building block for effective negotiation and improved outcomes.
Puyallup, WA Economic and Lifestyle Metrics for January 2026
The median household income of $95,639 and a city unemployment rate of 4.6 percent provide a supportive economic setting for transactions. These foundational metrics help explain why so many deals close smoothly: when incomes align to property values, more buyers qualify for financing and more sellers meet demand. Add in a local labor force of 24,000 and a solid rental market, and Puyallup, WA remains accessible to many types of movers.
- Median estimated property value: $573,940
- Median sold price (Dec 2025): $540,000
- Average closed price per square foot: $309
- Closed sales price range: $287,500–$749,989
- Distressed listings (3 months): 10
How to Stay Ahead in January’s Local Market
Aiming to stay ahead of the curve this month? Focus on the real time numbers and look for opportunities that match your goals. Whether you are learning how to sell your house fast in Puyallup, WA or focused on maximizing your offer, it is essential to keep these metrics close at hand. When considering timing, keep in mind that January 2026 is a pivotal period for both pricing and availability—a strategic approach makes every move count.
Tour Smarter, Offer Stronger
Work directly with Mike Rudnev to align budget, search alerts, and offer strategy for Puyallup, WA. Call or explore properties now in January 2026.
Looking Forward: Puyallup, WA Market Momentum
Puyallup, WA is primed for ongoing momentum and adaptability, setting the stage for a wide range of successes in early 2026. Buyers should stay tuned to both list prices and closed sales, while sellers can use these reports to maximize market timing. A locally grounded advisor can make the difference between a typical transaction and an outstanding one. For every client, making moves with data driven confidence is the key to long term satisfaction and value.